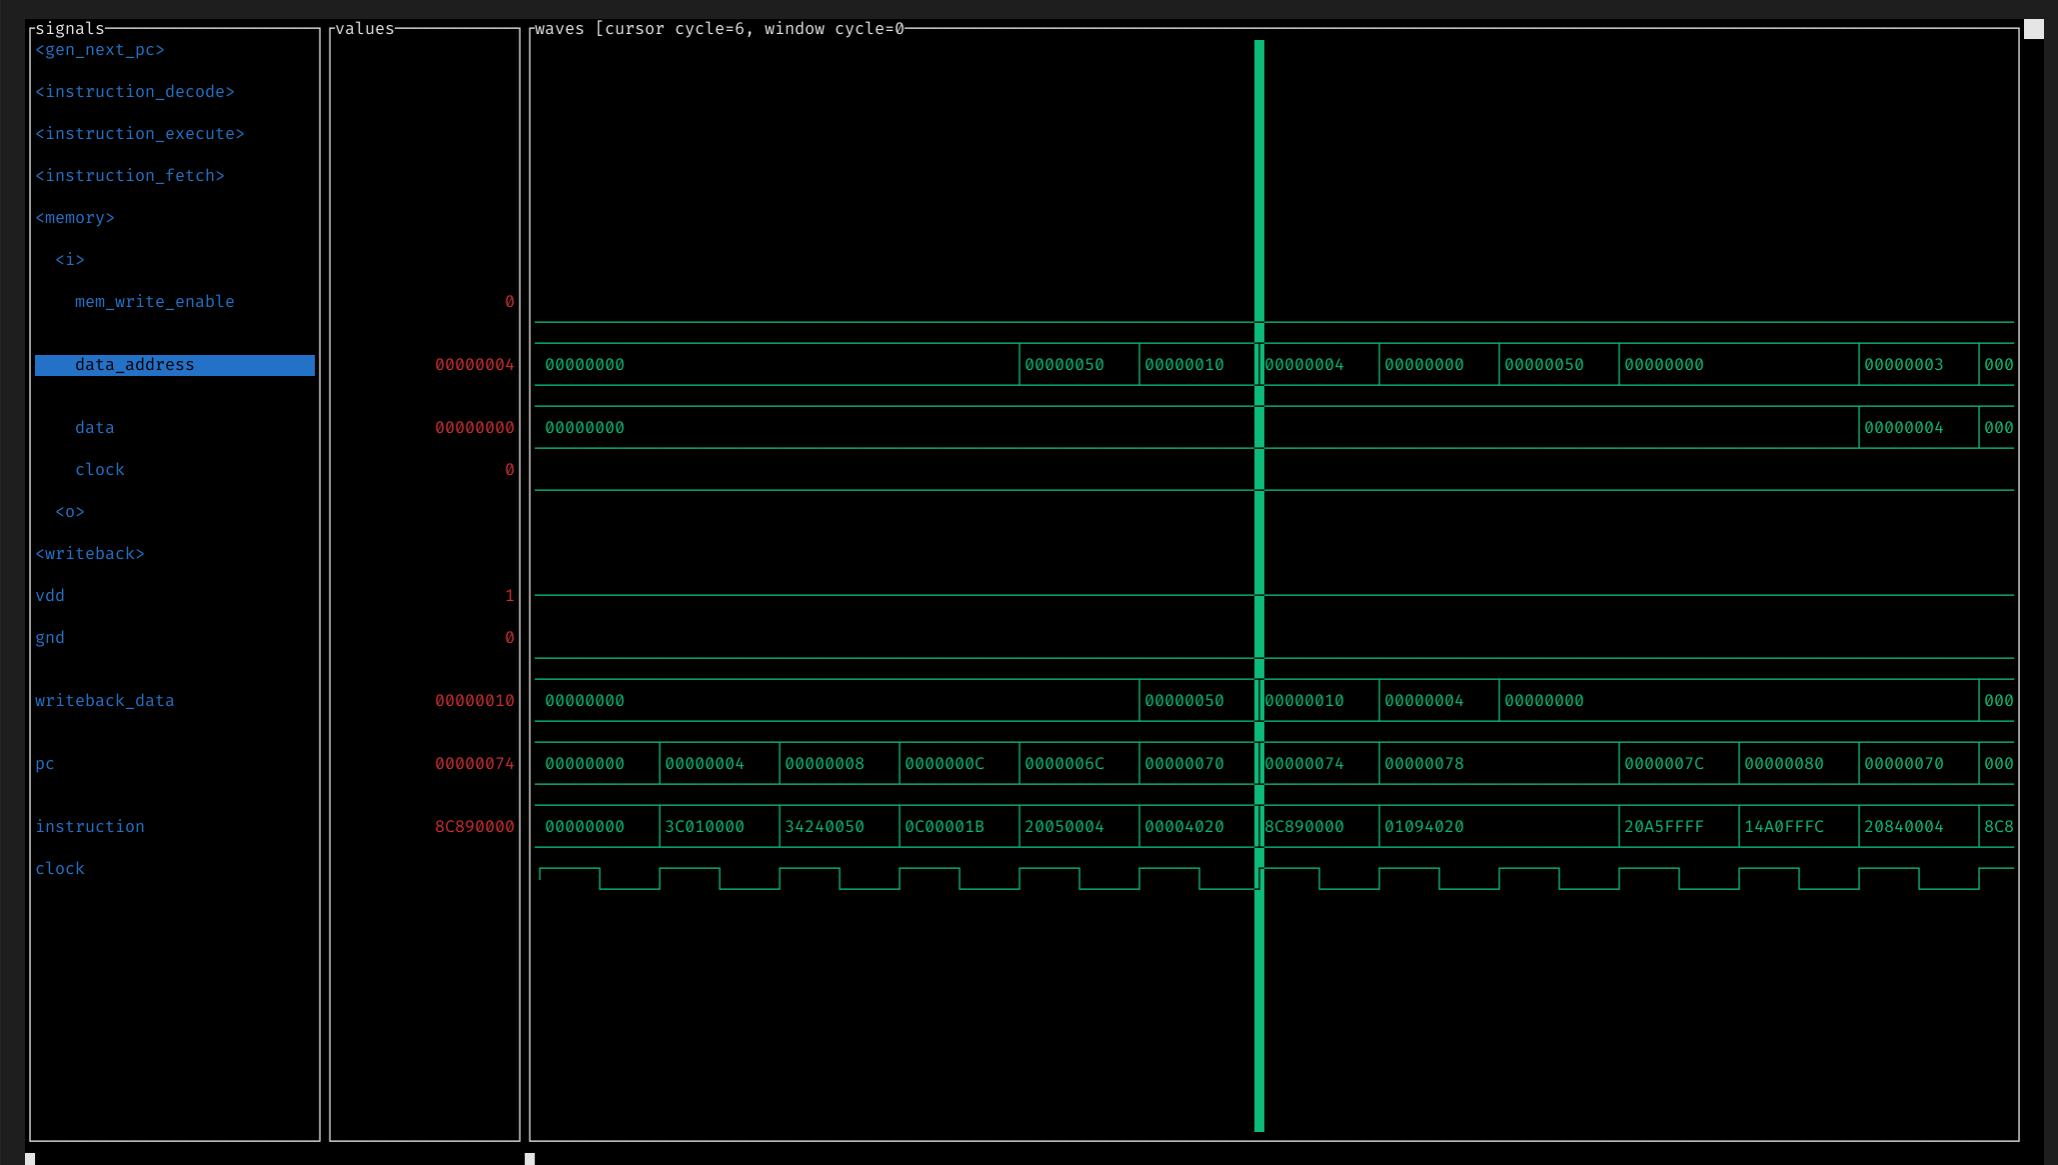
Hi, welcome back to our Hardcaml MIPS project! Today, we'll discuss how Hardcaml's interactive waveform viewer can be used to debug complex circuits. If you'd like to see the end-result of this post, it's tagged as v0.12.1 on GitHub.
This skips a bit ahead of the last post's v0.6.1. Since the goal of this series is to explore Hardcaml, not completely teach MIPS CPU design, we won't be making blog posts for every minor version. If you're interested in what we've done in the meantime, you can check out our changelog.
Automated Testing
Before we discuss the interactive waveform viewer, I want to emphasize that one of Hardcaml's superpowers is its support for automated, ASCII waveform expect tests. If you write unit tests for all your combinational and/or relatively simple circuits, you'll have a guarantee that they perform the way you want them to. This means that most bugs/issues will be in the top-level components that wire together simpler circuits.
Interactive Waveform Viewer
However, waveform tests aren't perfect for long, many-cycle simulations, as the output becomes jumbled when width exceeds your terminal's or IDE's width:

We can try to get around this by printing several segments of the waveform display instead of the whole thing at once. However, this still leaves us with a LOT of output to look through. Additionally, in unit tests, we want to try and test the behavior of small, individual pieces of our system. If we need over a dozen clock cycles for a simulation, that's probably not what we're doing.
More importantly, the testing tools we've discussed so far are focused on automated unit and integration tests. In other words, we want to programmatically assert that our circuits and subcircuits behave the way they should.
In addition to testing tools, we usually want to be able to debug our design. In particular, if there's a situation where actual behavior doesn't match expected outputs, we want to inspect the state of internals of our system so we can identify what part is causing the problem.
Luckily, the Hardcaml waveterm library (already used for formatting ASCII waveforms) comes with a built-in interactive terminal waveform viewer. This allows you to:
- Scroll through long waveform displays, viewing a chunk at a time.
- Click on the display to see the values of all signals at that point in time.
- Inspect internal signals that are inputs/outputs to subcircuits in a module hierarchy.
When set up, it should look something like:

Viewer Setup
We'll launch the interactive viewer by running an executable, similarly to how we run ./_build/default/main.exe to generate Verilog source code. There appears to also be an option to use the waveforms generated by expect tests, but I wasn't able to get that working on my machine.
To set up the executable, we'll add an interactive.ml file alongside main.ml in our top-level directory. We'll also add a directive to the top-level dune file so our executable gets compiled.
interactive.ml will look like:
open Hardcaml
open Hardcaml_waveterm
open Mips.Datapath
module Simulator = Cyclesim.With_interface (I) (O)

let testbench n =
  let scope = Scope.create ~auto_label_hierarchical_ports:true ~flatten_design:true () in
  let sim = Simulator.create ~config:Cyclesim.Config.trace_all (circuit_impl Mips.Program.sample scope) in
  let waves, sim = Waveform.create sim in

  for _i = 0 to n do
    Cyclesim.cycle sim
  done;

  waves

let () =
  let waves = testbench 15 in
  Hardcaml_waveterm_interactive.run ~wave_width:5 ~signals_width:30 waves
This is very similar to our expect integration tests for the entire circuit, with a few key differences:
- When creating a
Scope.t instance, we set ~auto_label_hierarchical_ports:true. This labels the data we track while simulating the circuit so that later, the viewer can figure out which subcircuit it's a part of.
- When creating a simulator instance, we set
~config:Cyclesim.Config.trace_all. This tells the simulator to log every internal signal that's part of an input/output to a subcircuit. Without that, you can't inspect subcircuit state. Note that if simulating larger circuits, you might want to log some, but not all internal circuits. See this discussion for more info.
- We still run
Cyclesim.cycle sim n times to simulate n cycles of operation. Since we're simulating the datapath, we don't provide any inputs. However, instead of expecting an output, we pass the generated waves to Hardcaml_waveterm_interactive.run, which triggers the interactive viewer to open.
Now, when you run dune build and ./_build/default/interactive.exe, you should see a waveform viewer that looks like the screenshot above.
Hardcaml Observations
- We enjoyed using the Hardcaml viewer much more than using Vivado's simulation tools back when we were doing this project in Verilog. It's very simple and easy to use, but also powerful. Also, the UI for collapsing / displaying subcircuit signals is very intuitive.
- It would be neat if the viewer could display internal signals that are part of the circuit's implementation, but not necessarily inputs/outputs to hierarchial subcircuits. However, this would probably be challenging to implement due to the way Hardcaml handles internal signal naming and management.
- There are some performance issues when loading lengthy simulations with many signals. This hasn't been a problem for our relatively simple project, but I can imagine challenges with large designs. For now, a workaround is editing the
interactive.ml executable to only track internal signals you care about, but that requires relaunching the simulation, which adds friction.
- Currently, if you want to change which signals are displayed, or the format in which they are displayed, you have to edit the
interactive.ml executable, recompile, and reload the viewer. These features could be built into the viewer to make customization easier.